Shader Basics: Go from a Color Gradient to an Animated Mandelbrot in a GPU Shader in One Lesson
To play with shaders, go to https://www.shadertoy.com/ and click “New” in the upper right (you can also create an account if you want to save your work as you play). It creates a new basic shader.
void mainImage( out vec4 fragColor, in vec2 fragCoord )
{
// Normalized pixel coordinates (from 0 to 1)
vec2 uv = fragCoord/iResolution.xy;

// Time varying pixel color
vec3 col = 0.5 + 0.5*cos(iTime+uv.xyx+vec3(0,2,4));

// Output to screen
fragColor = vec4(col,1.0);
}
The mainImage function has two arguments, one is output-able (fragColor), one is an input (fragCoord).
The first step in the function is to compute a u & v coordinate (basically a texture coordinate that tells you where you are within the area you’re going to apply a pattern). This is expressed as a unit-length 2D vector (u,v) that goes from one corner of the screen space to the opposite. The vec2 fragCoord actually arrives into the function in units of integer pixels, so we divide by the pre-provided variable iResolution.xy (another vec2) to make it unit-length. You can’t just normalize fragCoord to unit length because that wouldn’t account for the known maximum length of the vector. The .xy notation after iResolution is something called a swizzle, which is a way of extracting subcomponents from a vector of arbitrary dimension (iResolution could be 3D or more) , and composing them into a new vector of specified dimension (2D) in a particular order (x, y). You could swap the order by writing iResolution.yx or even do iResolution.xz if iResolution were a 3D vector. The uv vector now expresses a fraction indicating where our current pixel being rendered is, within the display area.
The second line of code creates a color that varies depending on the position within the uv coordinate space AND the elapsed time. It’s a bit complex at first glance, but they want to show something cool and demonstrate temporal animation, so that’s why it’s there. It produces a vec3 called col, which will contain r, g, b components. The range of each component is 0-1, so 0,0,0 is black, 1,1,1 is white, 1,0,0 is red, 0,1,0 green, 0,0,1 blue and everything else is somewhere in between.
The third line of code transfers the calculated RGB color into the final output variable, fragColor, which is actually a vec4 — it includes a fourth component, alpha, which specifies the opacity (inverse of transparency) of the fragment being emitted. In cases of multiple fragments being rendered at the same screen pixel, this would control blending of this fragment over top of prior fragments. In this case, the shadertoy tool is basically rendering the whole screen as a rectangular quadrangle, one time. The vec4() notation demonstrates a way to construct a vec4 from a vec3. The col variable is of data type vec3. We can’t just assign it to a vec4, because what would we put in the fourth component? So, by using the vec4(somevec3, 1.0) notation, we are specifying that the 1.0 (fully opaque) quantity should be inserted into the fourth component (named a, for alpha) of the vec4 as it is created.
Here’s an article about the datatypes within GLSL, including the vector types, and scalars, and such
https://www.khronos.org/opengl/wiki/Data_Type_(GLSL)
There are also matrices, which come in handy when transforming stuff, especially in 3d, and perspective.
Fun fact, the vec type can support up to four components (vec4) and the subcomponents can be accessed by index or shorthand names. Shorthand names can be x,y,z,w, or r,g,b,a, or s,t,p,q.
[0], x, r, and s are all the same componet, likewise, [1], y, g, and t are all the same. The intent is to use the wxyz names when you’re using it to store a positional coordinate, rgba when storing a color, and stpq for other coordinate types.
vec4 blah = vec4(1.0, 2.0, 3.0, 4.0);
float dest;
dest = blah[0]; // will assign a 1.0 to dest
dest = blah.g; // will assign a 2.0 to dest
So to simplify the example, comment out this line by putting // in front of it.
// vec3 col = 0.5 + 0.5*cos(iTime+uv.xyx+vec3(0,2,4));and put the simpler code below it
vec3 col = vec3(uv.xyx);and press the little play triangle in the lower left of the code editor area to recompile and run it.
You’ll get this
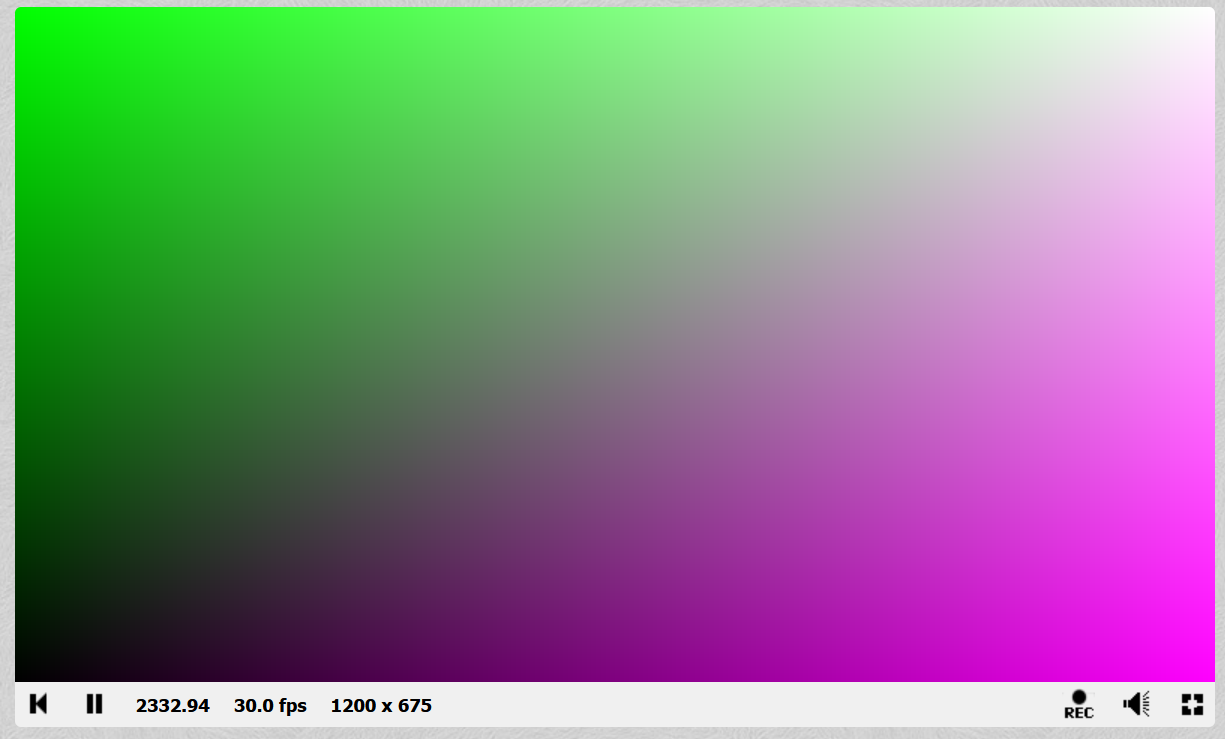
So, the RED is increasing from 0->1 from left to right everywhere.
The GREEN is increasing from 0->1 from the bottom to the top.
And the BLUE is a copy of the RED, so it also increases left-to-right.So in the lower left (0,0 is the lower left in this coordinate space, like paper math graphing) we get 0 R, G and B — black. In the upper right we get 1,1,1 RGB — white. Upper left gets no red, just green, and lower righth gets no green, just full RED and BLUE, which mix to make purple.
So, now that you see how to make a shader make a specified color anywhere on the screen, just by performing math based on (u,v) — which were computed from fragCoord and iResolution and some function you define, you can do just about anything imaginable. You just have to think about how to turn MATH into COLOR.
One simple technique used in early computer graphics was to make alternating-color checkerboards, using a modulo function and a scaling factor.
Here’s a shader to do that
void mainImage( out vec4 fragColor, in vec2 fragCoord )
{
// Normalized pixel coordinates (from 0 to 1)
vec2 uv = fragCoord/iResolution.xy; // Scale up UVs to define checker size
// Larger number = smaller squares
float scale = 8.0;
vec2 grid = floor(uv * scale);

// Checker pattern: sum of integer coords modulo 2
float checker = mod(grid.x + grid.y, 2.0);

// White if even, red if odd
vec3 col = mix(vec3(1.0, 0.0, 0.0), // red
vec3(1.0, 1.0, 1.0), // white
checker);

// Output to screen
fragColor = vec4(col,1.0);
}
It looks like this

If I wanted, I could probably do some more clever math to make the X and Y scaling isometric, so we’d have square checkerboards, but that’s beyond my intent here.
So, that demonstrates using more sophisticated color computations, and things like mod() and floor() and mix(). Mix blends two vecs together based on a proportion specified by the final, scalar argument.
That mod() business is really generating and combining two step functions. A step function creates a square wave with one cycle over the domain of 0->1
So, we can make the same thing by generating two square waves using only the fractional 0,1 part of the uv coordinates, and then XORing them together so that wherever they agree, it becomes one color (white) and otherwise the other.
    // Step at half-integers to test even/odd parity
float xParity = step(0.5, fract(grid.x * 0.5));
float yParity = step(0.5, fract(grid.y * 0.5));

// XOR gives checker pattern
float checker = abs(xParity - yParity);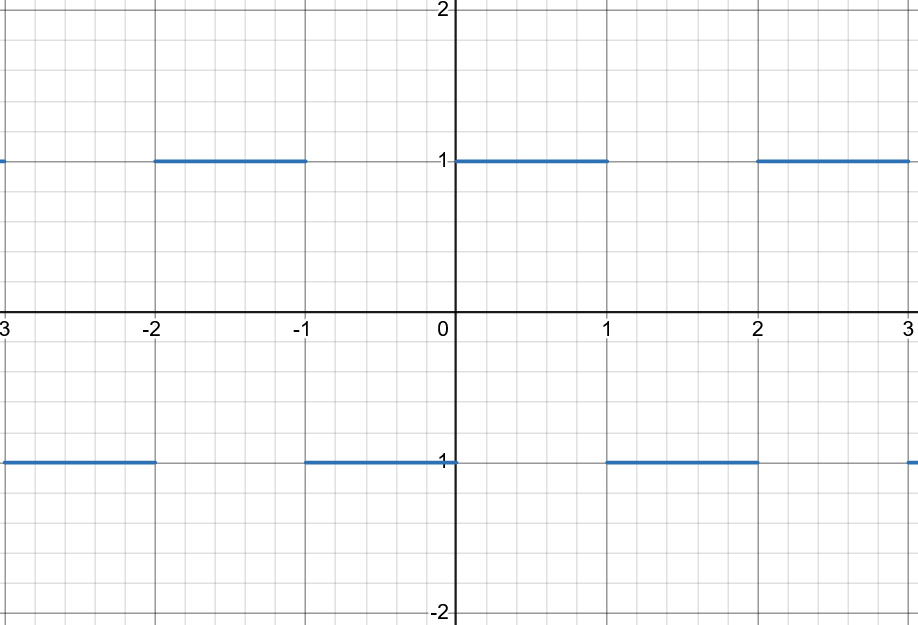
ASIDE: Computer graphics really dislikes SUPER hard edges like a step function. When scaled or viewed in perspective, if the edge doesn’t line up perfectly with a row of pixels on the screen, you can get stairstep patterns called aliasing, where an imperfectly sampled representation (the finite number of pixels on the screen) tries to represent an infinitely perfectly sharp signal (the abrupt mathematical transition between white and red. One way to cover over this problem is to never make edges that perfectly hard. There’s a smoothstep function that uses a Hermite interpolation to smooth off the sharp corners of the square wave.
I tried to retrofit smoothstep() into the original design with the following code, but I botched it and only am smoothing some of the edges due to the grid repeat method I adopted early on. But you get the idea.
void mainImage( out vec4 fragColor, in vec2 fragCoord )
{
vec2 uv = fragCoord / iResolution.xy;

float scale = 8.0;
float edge = 0.02; // widen/narrow AA band
vec2 grid = uv * (scale * 0.5); // halve scale to compensate for XOR halving

float sx = smoothstep(0.5 - edge, 0.5 + edge, fract(grid.x));
float sy = smoothstep(0.5 - edge, 0.5 + edge, fract(grid.y));
float checker = abs(sx - sy); // XOR

vec3 col = mix(vec3(1.0, 0.0, 0.0), vec3(1.0), checker);
fragColor = vec4(col, 1.0);
}
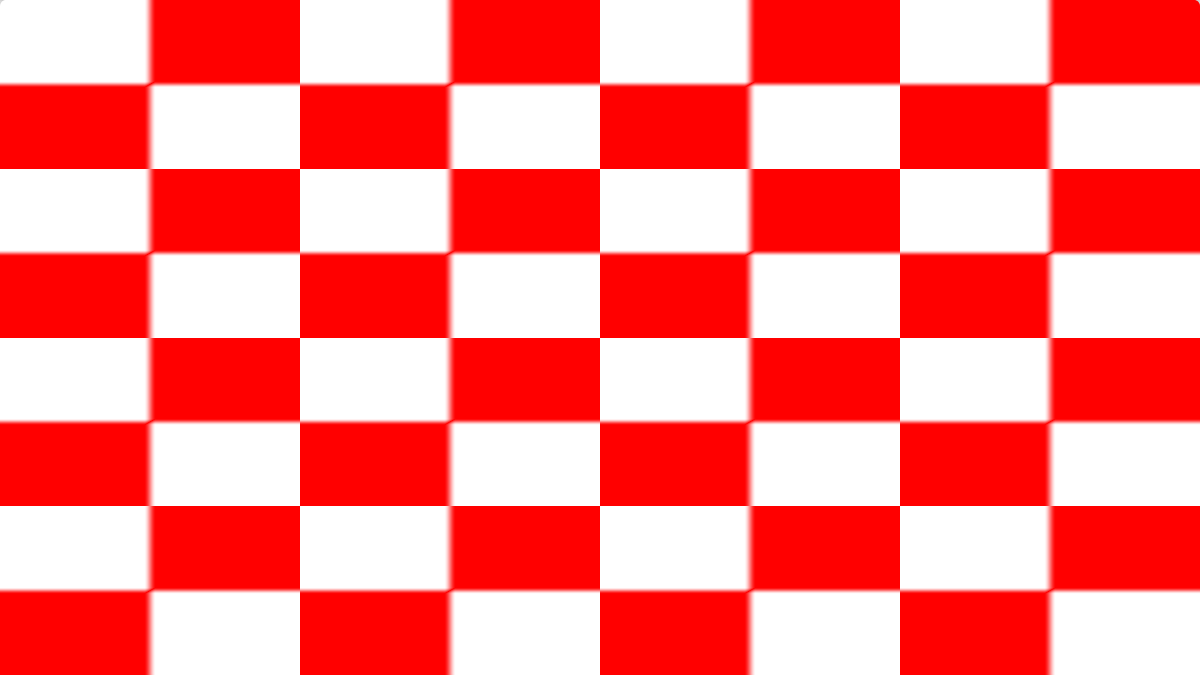
You can make the edge value smaller to sharpen the edge or higher (0.05) to blur it more to see which edges are and aren’t blurring correctly.
I’m gonna go back to the hard-edged version to re-introduce temporal animation.
The original New project had a time-based color driven by this
vec3 col = 0.5 + 0.5*cos(iTime+uv.xyx+vec3(0,2,4));What’s going on there is iTime is a special pre-supplied variable that ShaderToy gives us that is set to the current clock time in floating point seconds (I’m not sure when time=0.0 was, but it will continually increase as the browser window stays open and displaying). (Here’s a ShaderToy cheat sheet https://gist.github.com/markknol/d06c0167c75ab5c6720fe9083e4319e1 )
One clever thing is that iTime is a scalar floating point (float) variable. But uv is a vec2, and uv.xyx constructs a vec3 (made from uv.x, uv.y, uv.x by swizzling). When you ask GLSL to multiply a scalar by a float, or other mismatched type dimensions, it tries to do the smart thing and apply the smaller type across the bigger type. So, it’s really creating a new vec3 out of iTime * uv.x, iTime * uv.y, iTime * uv.x. Then it adds a vec3(0,2,4) to mix things up, and calls cos() (cosine) on the combined vec3, which really calls cosine on each of the three scalar components of the vec3. Then it scales and shifts that to get it in the 0,1 range instead of -0.5,+0.5, and uses it as the RGB components to display.
Remember, that kinda looks like this, only moving

If we wanted to incorporate iTime, we could use it to shift our checkerboard, by changing to
vec2 grid = floor((iTime + uv) * scale);This makes the grid move diagonally (we’re applying a seconds-based offset to X and Y) but it’s really fast. I can slow it down by scaling iTime down by 0.05
vec2 grid = floor((0.05 * iTime + uv) * scale);***INSERT A VIDEO HERE***
Weirdly, the examples on the Penumbra getting started page ( https://penumbra.hackclub.com/#getting-started ) don’t seem to work as-is in ShaderToy, because they don’t declare the expected mainImage() function name.
And they return the fragColor instead of assigning it to a special variable. I think that was an older GLSL dialect.
Anyway, I updated one of their examples, the third, trig demo one
void mainImage( out vec4 fragColor, in vec2 fragCoord )
{
// Normalized pixel coordinates (from 0 to 1)
vec2 uv = fragCoord/iResolution.xy;

float x = uv.x, y = uv.y;
float v = 15.0 * sin((x * x - y * y) * 10.0);
vec3 col = vec3(
0.5 + 0.5 * sin(v),
0.0,
0.5 + 0.5 * sin(v + 4.0)
);

// Output to screen
fragColor = vec4(col,1.0);
}
It looks like
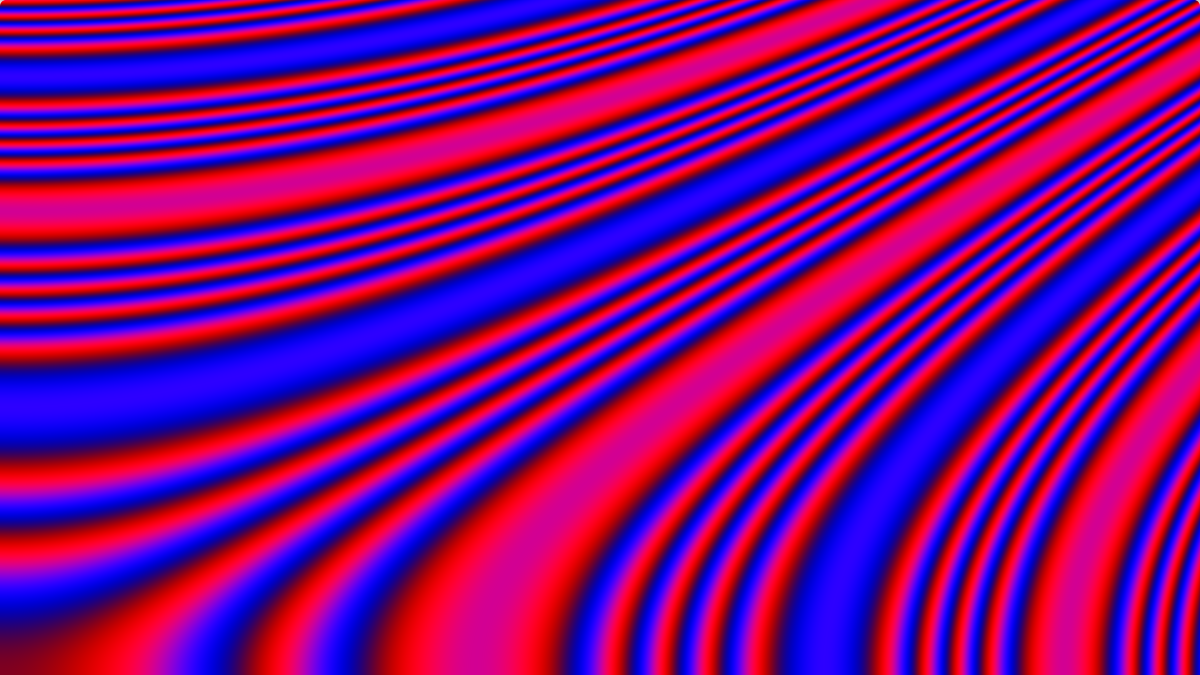
Basically, they’re throwing trig functions and constants into a blender to generate RGB values. It might be interesting to add motion to that using iTime so you could move around the pattern, which should be mathematically infinite.
There’s an iMouse variable in ShaderToy that contains the current mouse position within the drawing space, expressed in the same units as iResolution, so you could do fun stuff with that to move the pattern interactively.
Let’s try adopting it
    // Normalized pixel coordinates with mouse-centered origin (translation only)
vec2 uv = (fragCoord - iMouse.xy) / iResolution.xy;
It actually works, though it only seems to get iMouse value updates when you click on the drawing space. Well, close enough, you get the idea.
Intuitively, the pattern matches the original when the mouse is in the lower left 0,0 location.
You can actually use this to plot a mathematical function of nearly arbitrary complexity. Here’s a simple example plotting y=sin(x) with a period and scale tweaked to be visible on the range of coordinates displayed in the drawing space
void mainImage( out vec4 fragColor, in vec2 fragCoord )
{
// Normalized pixel coordinates
vec2 uv = fragCoord / iResolution.xy;
const float PI = 3.14159265358979323846;

// Curve parameters (in pixels)
float periodPx = 200.0; // wavelength along X
float ampPx = 0.25 * iResolution.y; // amplitude along Y
float centerY = 0.5 * iResolution.y; // vertical center line

// y = sin(x) in pixel space
float x = fragCoord.x;
float resultY = sin(x * (2.0*PI / periodPx)); // [-1, 1]
float yExpect = centerY + ampPx * resultY; // expected screen Y (px)

// 1-pixel band around the curve
float halfThicknessPx = 0.5;
float d = abs(fragCoord.y - yExpect);
float onCurve = 1.0 - step(halfThicknessPx, d); // 1 when inside band

// White background, black curve
vec3 col = mix(vec3(1.0), vec3(0.0), onCurve);
fragColor = vec4(col, 1.0);
}
It draws
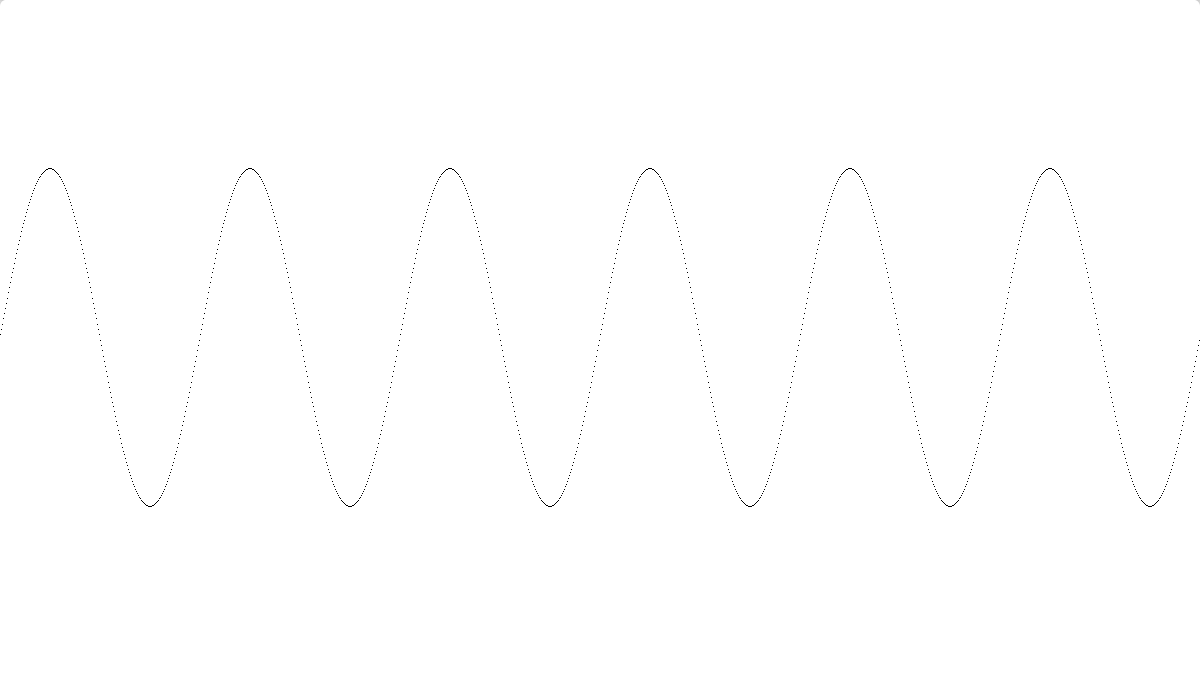
You can change
float resultY = sin(x * (2.0*PI / periodPx)); // [-1, 1]into whatever you like.
Here’s another example of plotting a function (and many other cool things on the same page) https://salvatorespoto.github.io/post/shadertoy-basics/#draw-a-function
Here’s a version of the function plotter that has the mouse-scrolling ability and uses smoothstep to make smoother-edged pixels
void mainImage( out vec4 fragColor, in vec2 fragCoord )
{
// Keep this line exactly to allow XY panning via mouse (translation only)
vec2 uv = (fragCoord - iMouse.xy) / iResolution.xy;
// Pixel-space params
const float PI = 3.141592653589793;
float periodPx = 200.0; // sine period in pixels (x)
float ampPx = 0.25 * iResolution.y; // amplitude in pixels (y)

// Compute y = sin(x) in pixel space, translated by mouse
float x = fragCoord.x - iMouse.x; // mouse-centered x (px)
float resultY = sin(x * (2.0*PI/periodPx)); // [-1,1]
float yExpected = iMouse.y + ampPx * resultY; // expected screen y (px)

// 1-pixel thick line: draw when |frag.y - yExpected| < 0.5 px
float d = abs(fragCoord.y - yExpected);
float line = 1.0 - smoothstep(0.0, 1.0, d);

// White background, black curve
vec3 col = mix(vec3(1.0), vec3(0.0), line);
fragColor = vec4(col, 1.0);
}
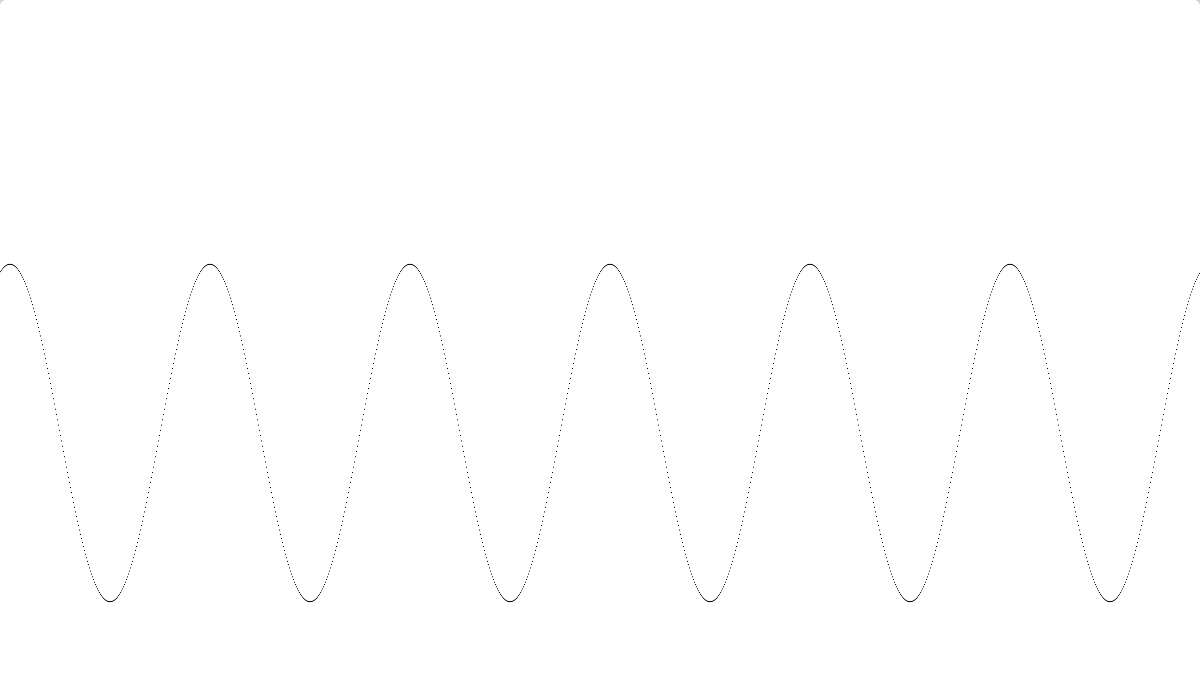
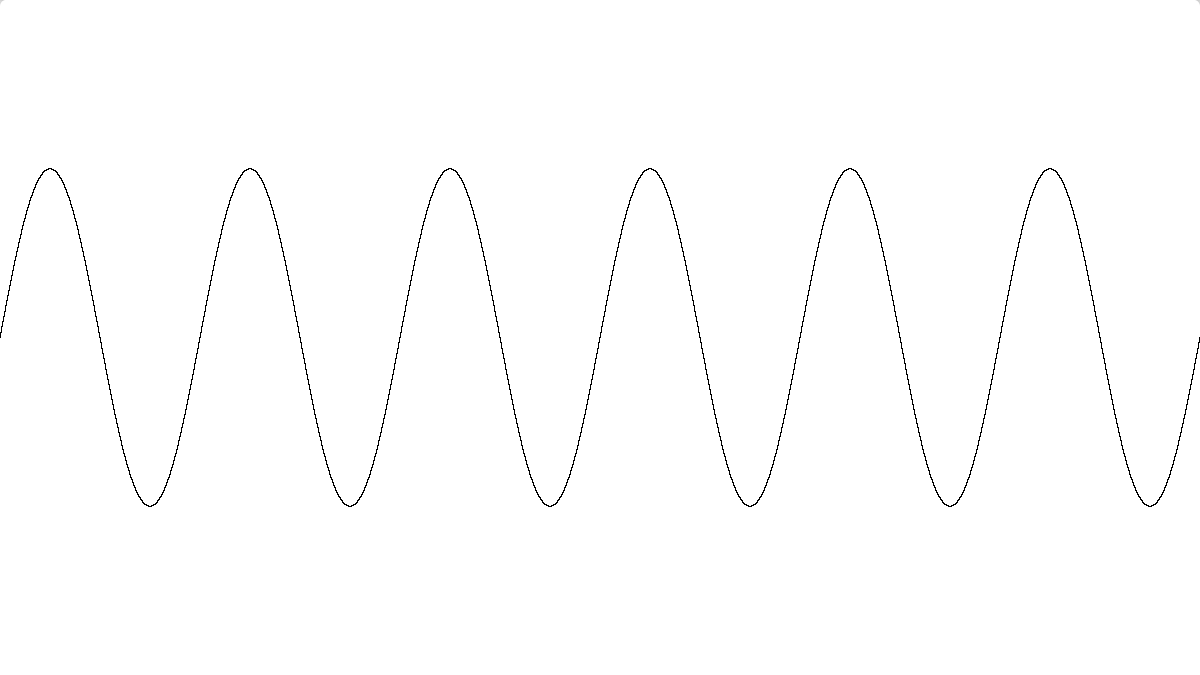
There’s still a sampling issue (another “aliasing” problem). We are evaluating the sin() function at the integer coordinate of each “fragment” or pixel that gets drawn. And then we see if the resulting output sin value is within one pixel distance vertically of our pixel fragment’s own y coordinate. But in some places, the sin function changes rapidly, more than one pixel vertical per pixel of horizontal change. What we REALLY would need to do is iterate the entire X domain COVERED by our pixel fragment, evaluate all the Y values of the sin(x) function, and see if ANY of them fall within the Y +- 0.5 pixel space of our pixel. This would be a bulk “supersampling” antialiasing, and it works, it just costs more computation. Another approach would be to test just the far left edge and far right edge x coordinates of our pixel and see if our pixel’s y coordinate fell between them. That would work for continuous functions that didn’t have too many crazy perturbations.
This doesn’t have the mouse panning, to try to keep the complexity sane for easier understanding:
// Plot y = sin(x), discontinuity-resistant via left/right edge sampling.
// Draw the pixel if [frag.y-0.5, frag.y+0.5] overlaps [min(y0,y1), max(y0,y1)].

void mainImage( out vec4 fragColor, in vec2 fragCoord )
{
vec2 uv = fragCoord / iResolution.xy; // not used; kept for familiarity

const float PI = 3.14159265358979323846;

// Curve parameters (in pixels)
float periodPx = 200.0; // wavelength along X
float ampPx = 0.25 * iResolution.y; // amplitude along Y
float centerY = 0.5 * iResolution.y; // vertical center line

// Pixel's horizontal extent in pixel space
float x0 = fragCoord.x - 0.5;
float x1 = fragCoord.x + 0.5;

// Evaluate the function at both edges
float k = 2.0 * PI / periodPx;
float y0 = centerY + ampPx * sin(k * x0);
float y1 = centerY + ampPx * sin(k * x1);

// Expand the y-segment by half a pixel to get ~1 px thickness
float yMin = min(y0, y1) - 0.5;
float yMax = max(y0, y1) + 0.5;

// Overlap test: does the pixel center y lie in the expanded segment?
float y = fragCoord.y;
float on = step(yMin, y) * step(y, yMax); // 1 if yMin <= y <= yMax

// White background, black curve
vec3 col = mix(vec3(1.0), vec3(0.0), on);
fragColor = vec4(col, 1.0);
}
For the piece de resistance of the lesson, here’s an incredibly complex iterative 2d function called the Mandelbrot set. For each xy position, a function is computed using complex numbers, and if the result has not met a range criteria, it is iterated again. Once the result goes out of a particular range, the count of iterations performed before going out of range is mapped into a color. If the result never goes out of range, a mercy threshold (MAX_ITER which is 200 iterations here) is hit and the point is colored black, and considered to be “within the Mandelbrot set”. In the 80s, we’d leave computers calculating Mandelbrot sets for hours and days to see a low-res pretty picture. Now we can do it at high-res in realtime.
This code uses two separate functions to create a rainbow spectrum from a scalar value.
// Minimal Mandelbrot with ROYGBIV coloring via HSV.
// No zoom/pan. Fills the viewport with the full set domain.
// Palette: hue from 0..1, s=1, v=1 via rainbow(value) -> HSV, then hsv2rgb.
vec3 hsv2rgb(vec3 c)
{
// c = (h, s, v), h in [0,1]
vec3 p = abs(fract(c.x + vec3(0.0, 1.0/3.0, 2.0/3.0)) * 6.0 - 3.0);
return c.z * mix(vec3(1.0), clamp(p - 1.0, 0.0, 1.0), c.y);
}

// Map scalar t in [0,1] to an HSV rainbow (ROYGBIV) at full saturation/value.
vec3 rainbow(float t)
{
return vec3(fract(t), 1.0, 1.0); // HSV
}

void mainImage( out vec4 fragColor, in vec2 fragCoord )
{
// Normalized pixel coordinates (0..1)
vec2 uv = fragCoord / iResolution.xy;

// Map to the classic Mandelbrot domain: x in [-2.5, 1.0], y in [-1.0, 1.0]
vec2 c = vec2(
mix(-2.5, 1.0, uv.x),
mix(-1.0, 1.0, uv.y)
);

// Iterate z_{n+1} = z_n^2 + c
vec2 z = vec2(0.0);
const int MAX_ITER = 200; // reasonable cutoff
int i;
for (i = 0; i < MAX_ITER; ++i)
{
// z^2 in complex plane
vec2 z2 = vec2(z.x*z.x - z.y*z.y, 2.0*z.x*z.y) + c;
z = z2;

// Escape if |z|^2 > 4
if (dot(z, z) > 4.0) break;
}

// Color: inside set = black; outside = rainbow by normalized iteration count
vec3 col = (i == MAX_ITER)
? vec3(0.0)
: hsv2rgb(rainbow(float(i) / float(MAX_ITER)));

fragColor = vec4(col, 1.0);
}
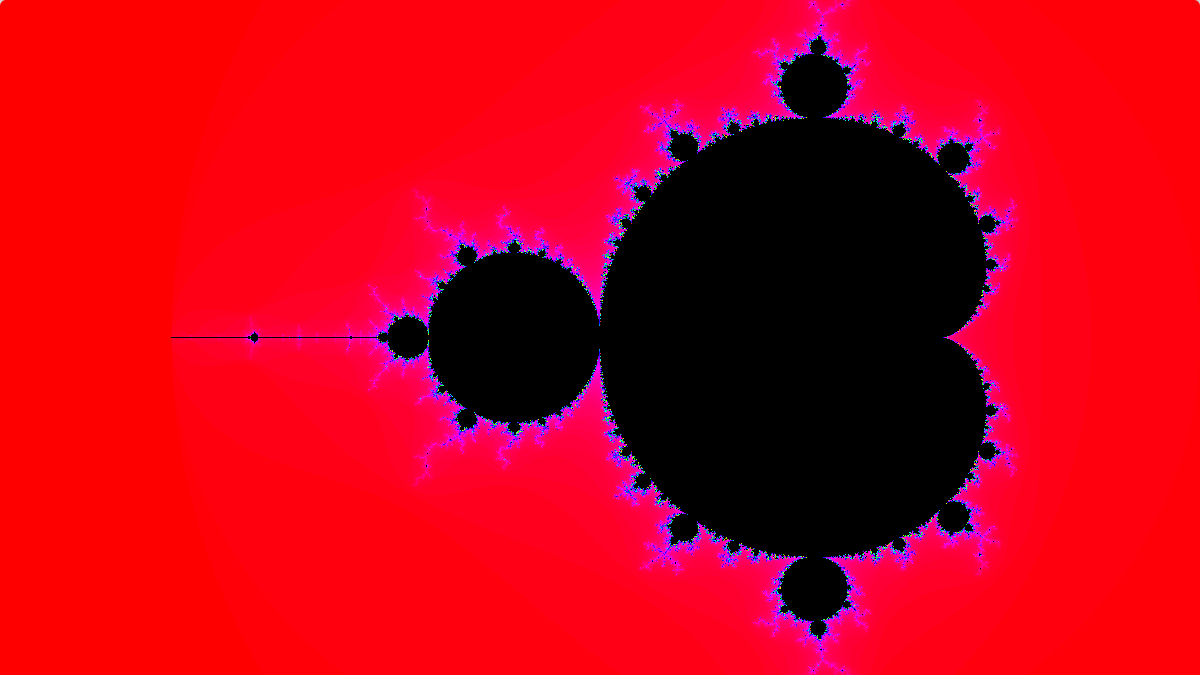
Ok, I couldn’t resist. I had to do one more thing once it occurred to me.
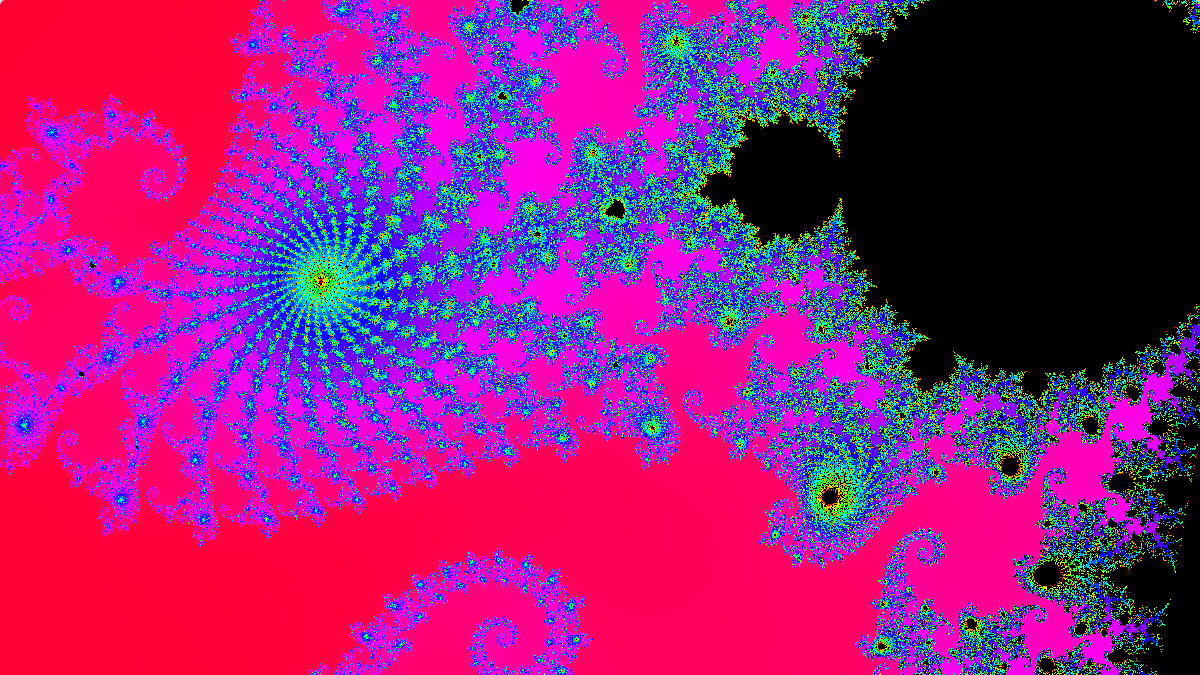
I added animation. The Mandelbrot set is infinite, with chaotic and beautiful details appearing as you zoom in. You have to raise the MAX_ITER to see some of them because they’re in the black at lower iterations. I set up a 60 second zoom into an interesting site
You have to hit the Reset time button on the lower left of the Shadertoy

Because it’s fully zoomed out at iTime=0 and fully zoomed in at iTime >= 60.0
Here is the whole Mandelbrot Shader code.
Here’s the video:
Here’s one of the snapshots from near the end, showing the complex beauty of the Mandelbrot Set.
I published my shader on Shadertoy here if anyone wants to experiment or just view it
https://www.shadertoy.com/view/3clfD7
We Solve Your Difficult Problems
AlphaPixel solves difficult problems every day for clients around the world. We develop computer graphics software from embedded and safety-critical driver level, to VR/AR/xR, plenoptic/holographic displays, avionics and mobile devices, workstations, clusters and cloud. We’ve been in the computer graphics field for 35+ years, working on early cutting-edge computers and even pioneering novel algorithms, techniques, software and standards. We’ve contributed to numerous patents, papers and projects. Our work is in open and closed-source bases worldwide.
People come to us to solve their difficult problems when they can’t or don’t want to solve them themselves. If you have a difficult problem you’re facing and you’re not confident about solving it yourself, give us a call. We Solve Your Difficult Problems.